The Aerospike Quick Start is an automated deployment guide built by Aerospike and Amazon Web Services (AWS) Solutions Architects to get you started with Aerospike. It’s best suited for users who want to get started with Aerospike on the AWS Cloud using current best practices, high availability, and security-related features. More details about Aerospike Quick Start can be found here.
In this blog, we are going to cover new additions to AWS Quickstart :
asbench
Monitoring stack (Prometheus + Grafana)
These additional elements will allow verifying your installation by generating load and by visualizing the status and activity in your cluster.
Aerospike Quickstart with monitoring stack and asbench
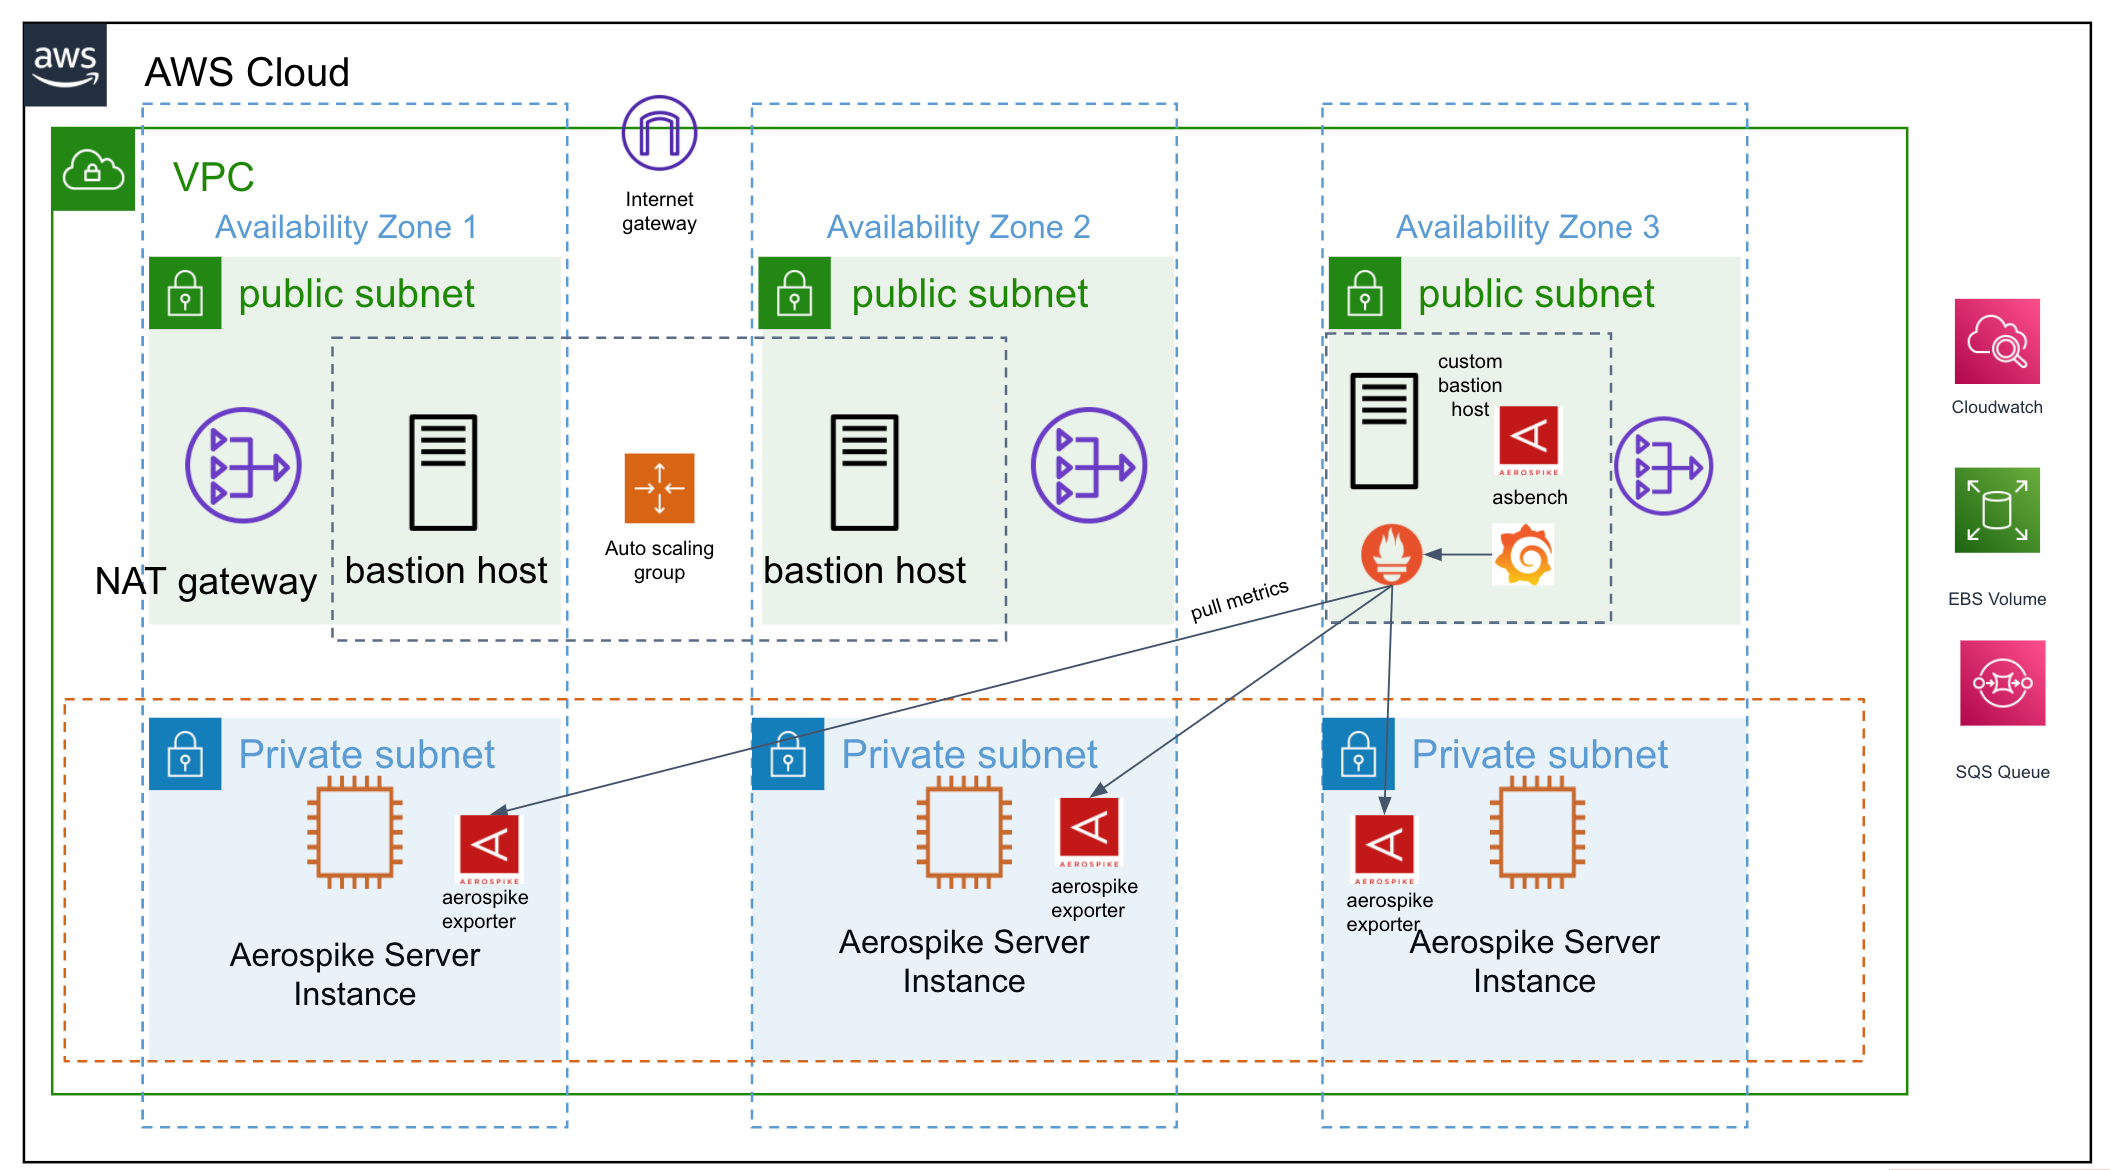
Architecture is similar to previous Quick Start with the addition of a monitoring bastion host which uses linux bastion host as a reference. In the above diagram we can see a custom bastion host (Monitoring bastion) on public subnet which has asbench (the Aerospike benchmarking tool), Prometheus and Grafana installed. Prometheus scrapes metrics from aerospike prometheus exporter residing in Aerospike nodes on private subnets. See Aerospike Monitoring stack for more details.
Using Quickstart
In terms of usage, there are no major changes in CloudFormation input except, in this case, the “Monitoring Bastion Host” gets created by default and the user will have the option to disable it using the dropdown provided in the CFT parameter.
The following is an example for deploying Aerospike on new VPC with this change:
Step 1 : Get CloudFormation template from here
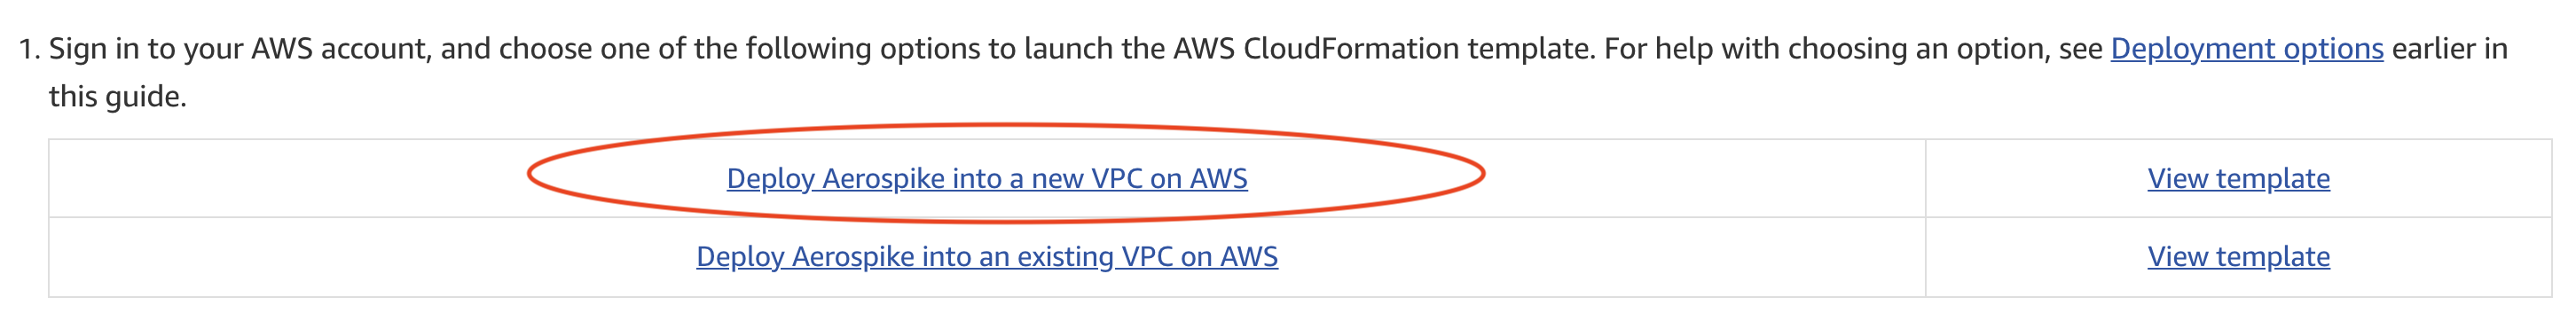
Launch quickstart on new vpc
Step 2 : Fill CloudFormation values
Fill values appropriately and create a stack. Notice the new section “Enable Monitoring Stack” which adds monitoring stack and asbench.
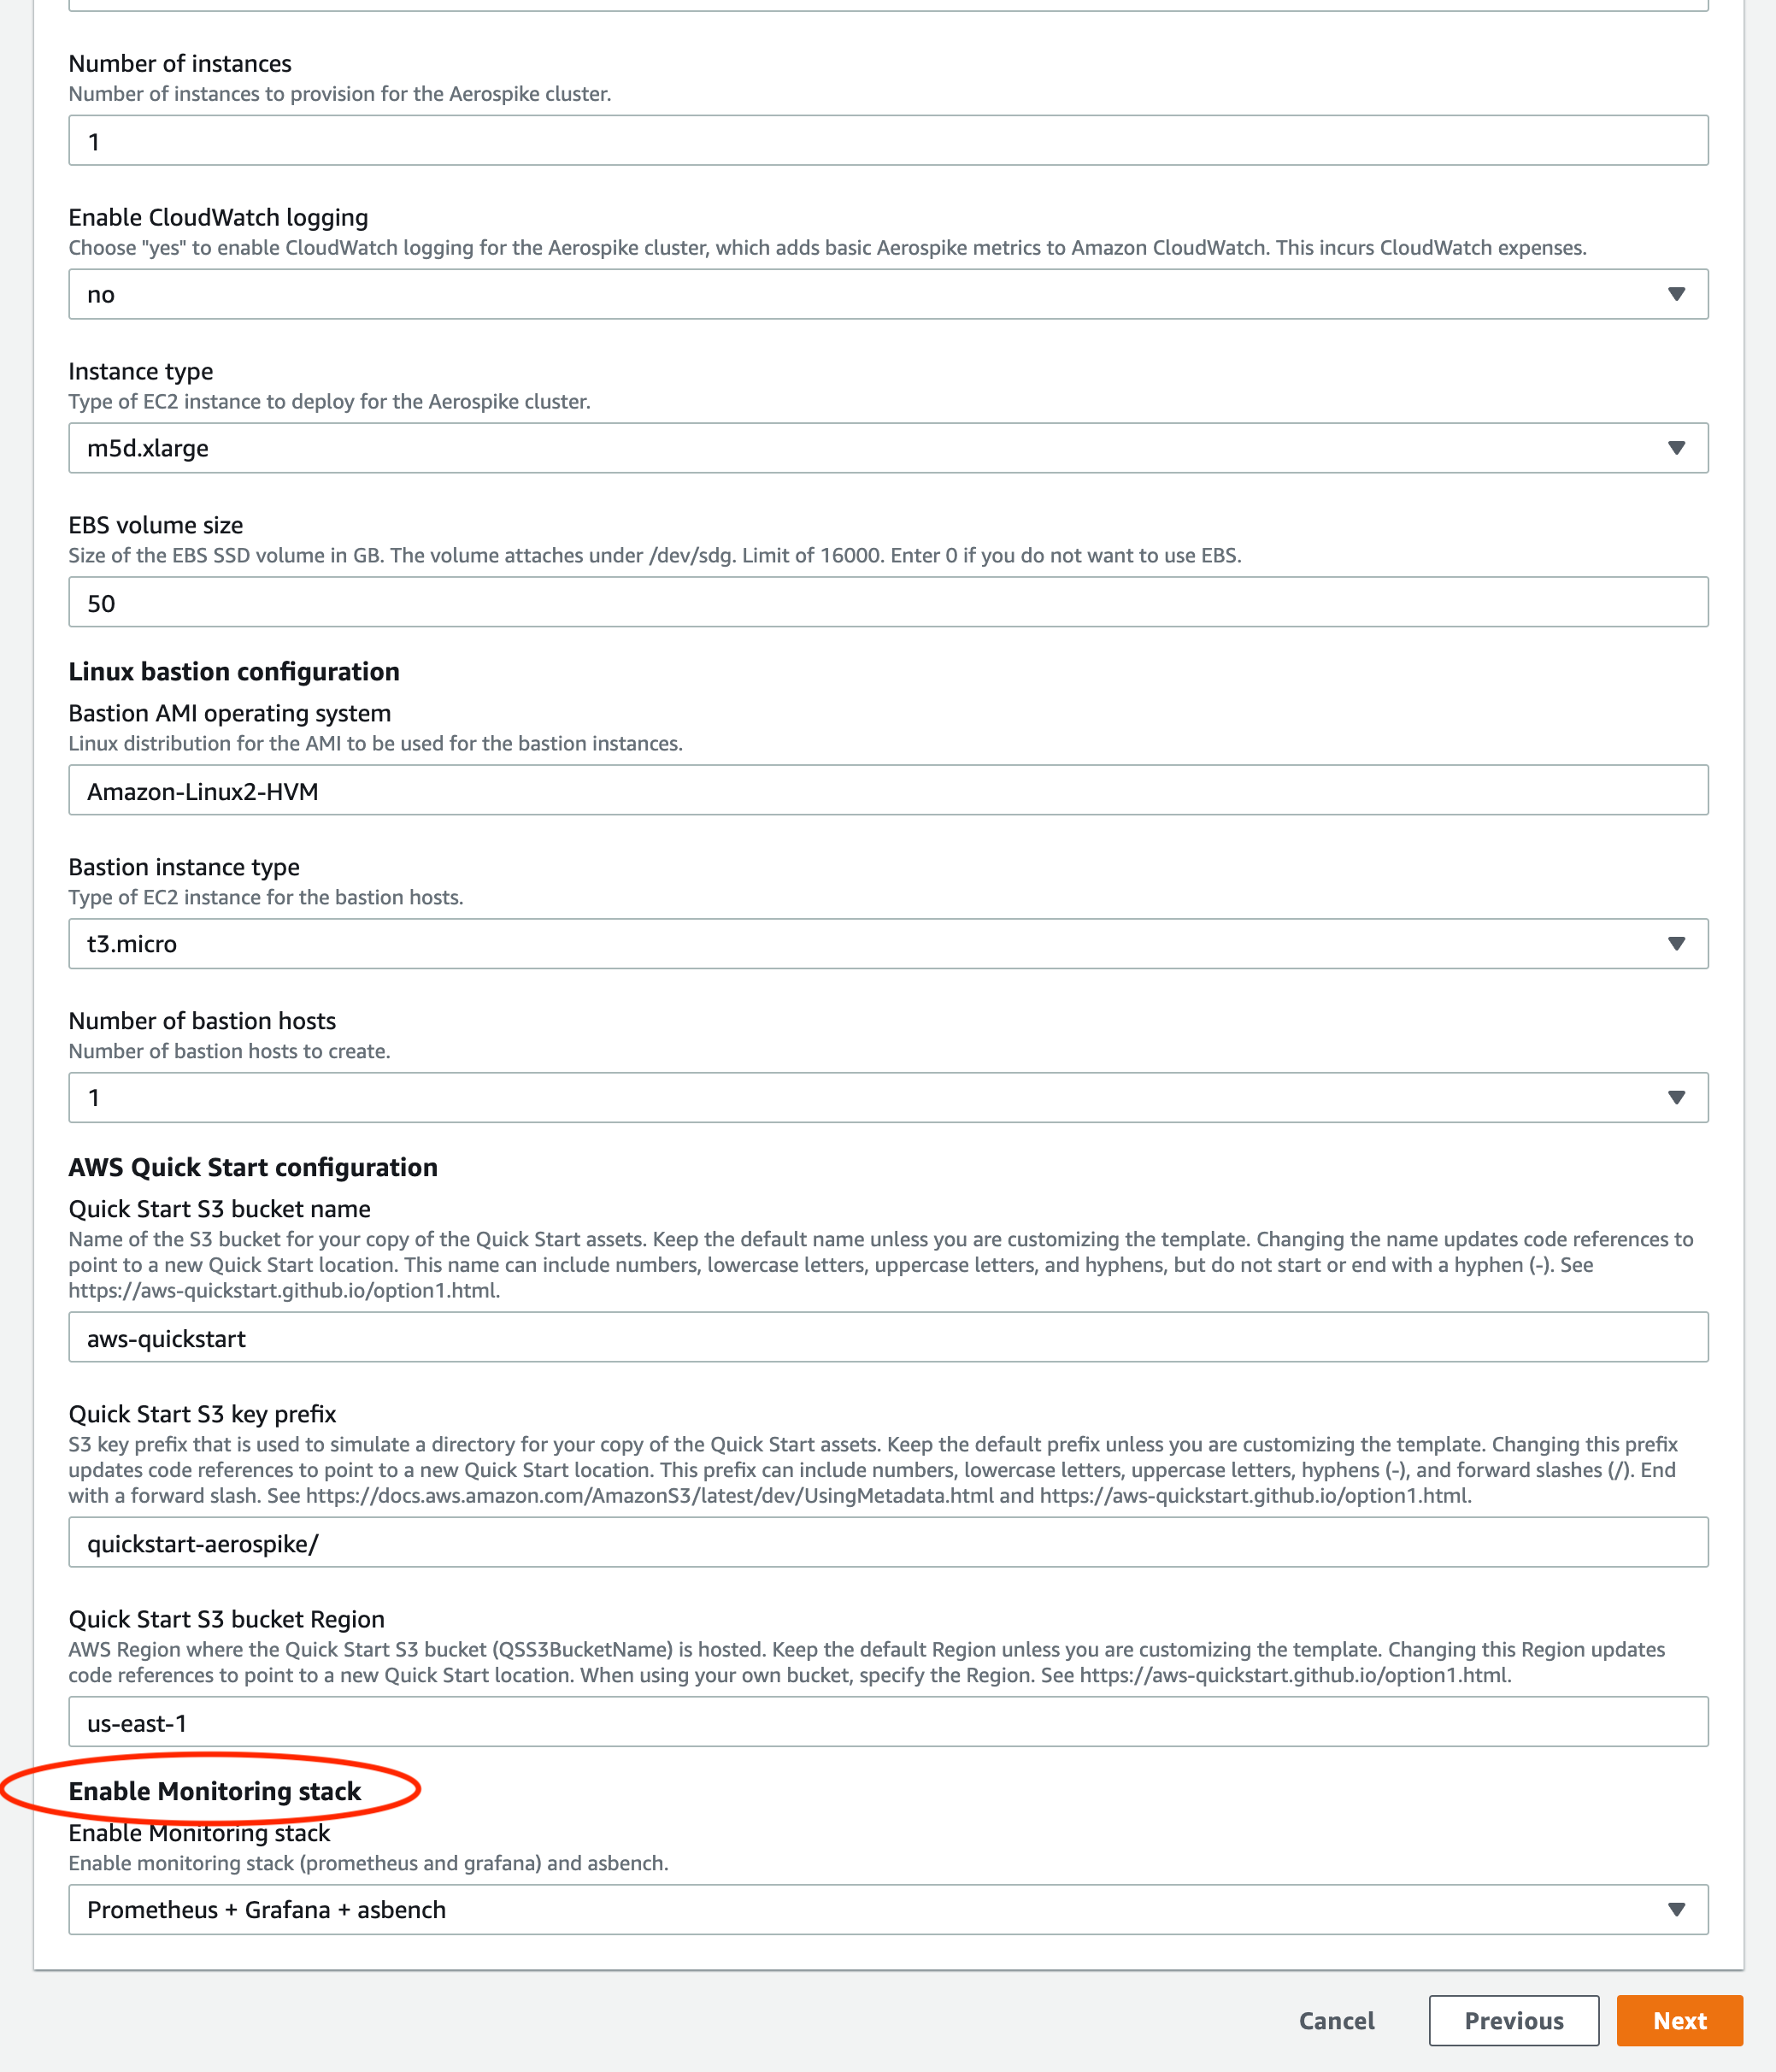
Enable monitoring stack and asbench
Once the stack is created successfully, notice a new EC2 instance named “Monitoring Bastion Host” running.
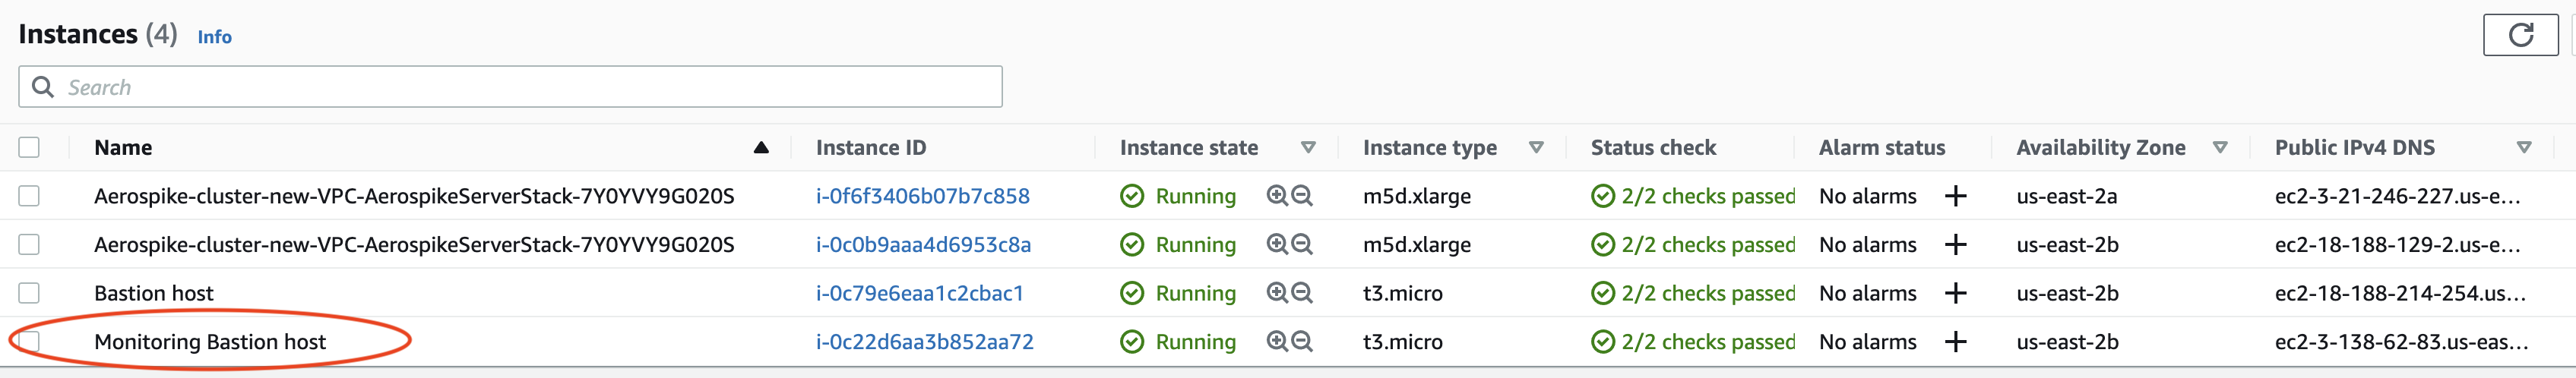
Monitoring bastion host
Accessing Monitoring Stack
Prometheus v2.30.3 is installed into the monitoring host as part of the CFT deployment process. Since Prometheus runs on port 9090, UI can be accessed at: http://<PUBLIC_IP_OF_MONITORING_BASTION_HOST>:9090
Prometheus is configured with default settings along with aerospike prometheus exporter being installed on each aerospike nodes.
Grafana 8.2.1–1 is installed into the monitoring host. Since Grafana runs on port 3100, the Grafana dashboard can be accessed at: http://<PUBLIC_IP_OF_MONITORING_BASTION_HOST>:3100
Note: Aerospike dashboards are automatically added in Grafana.
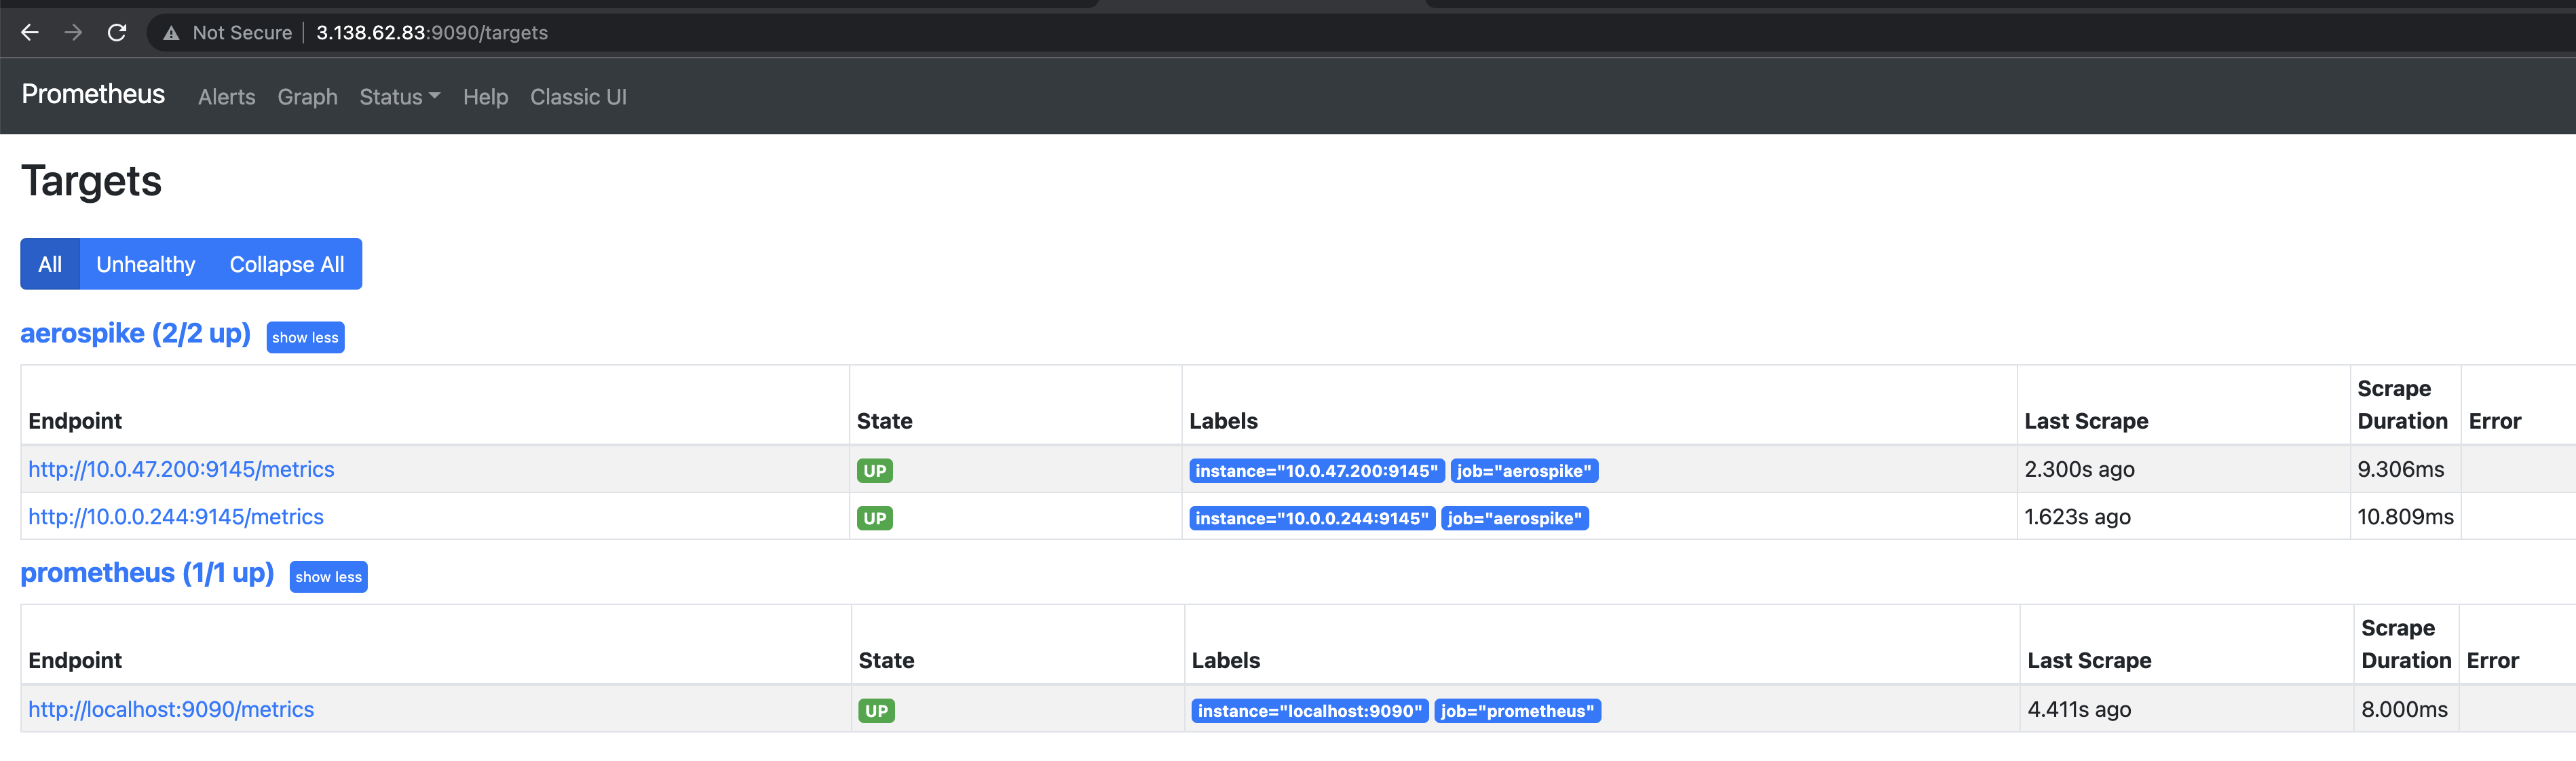
Prometheus targets
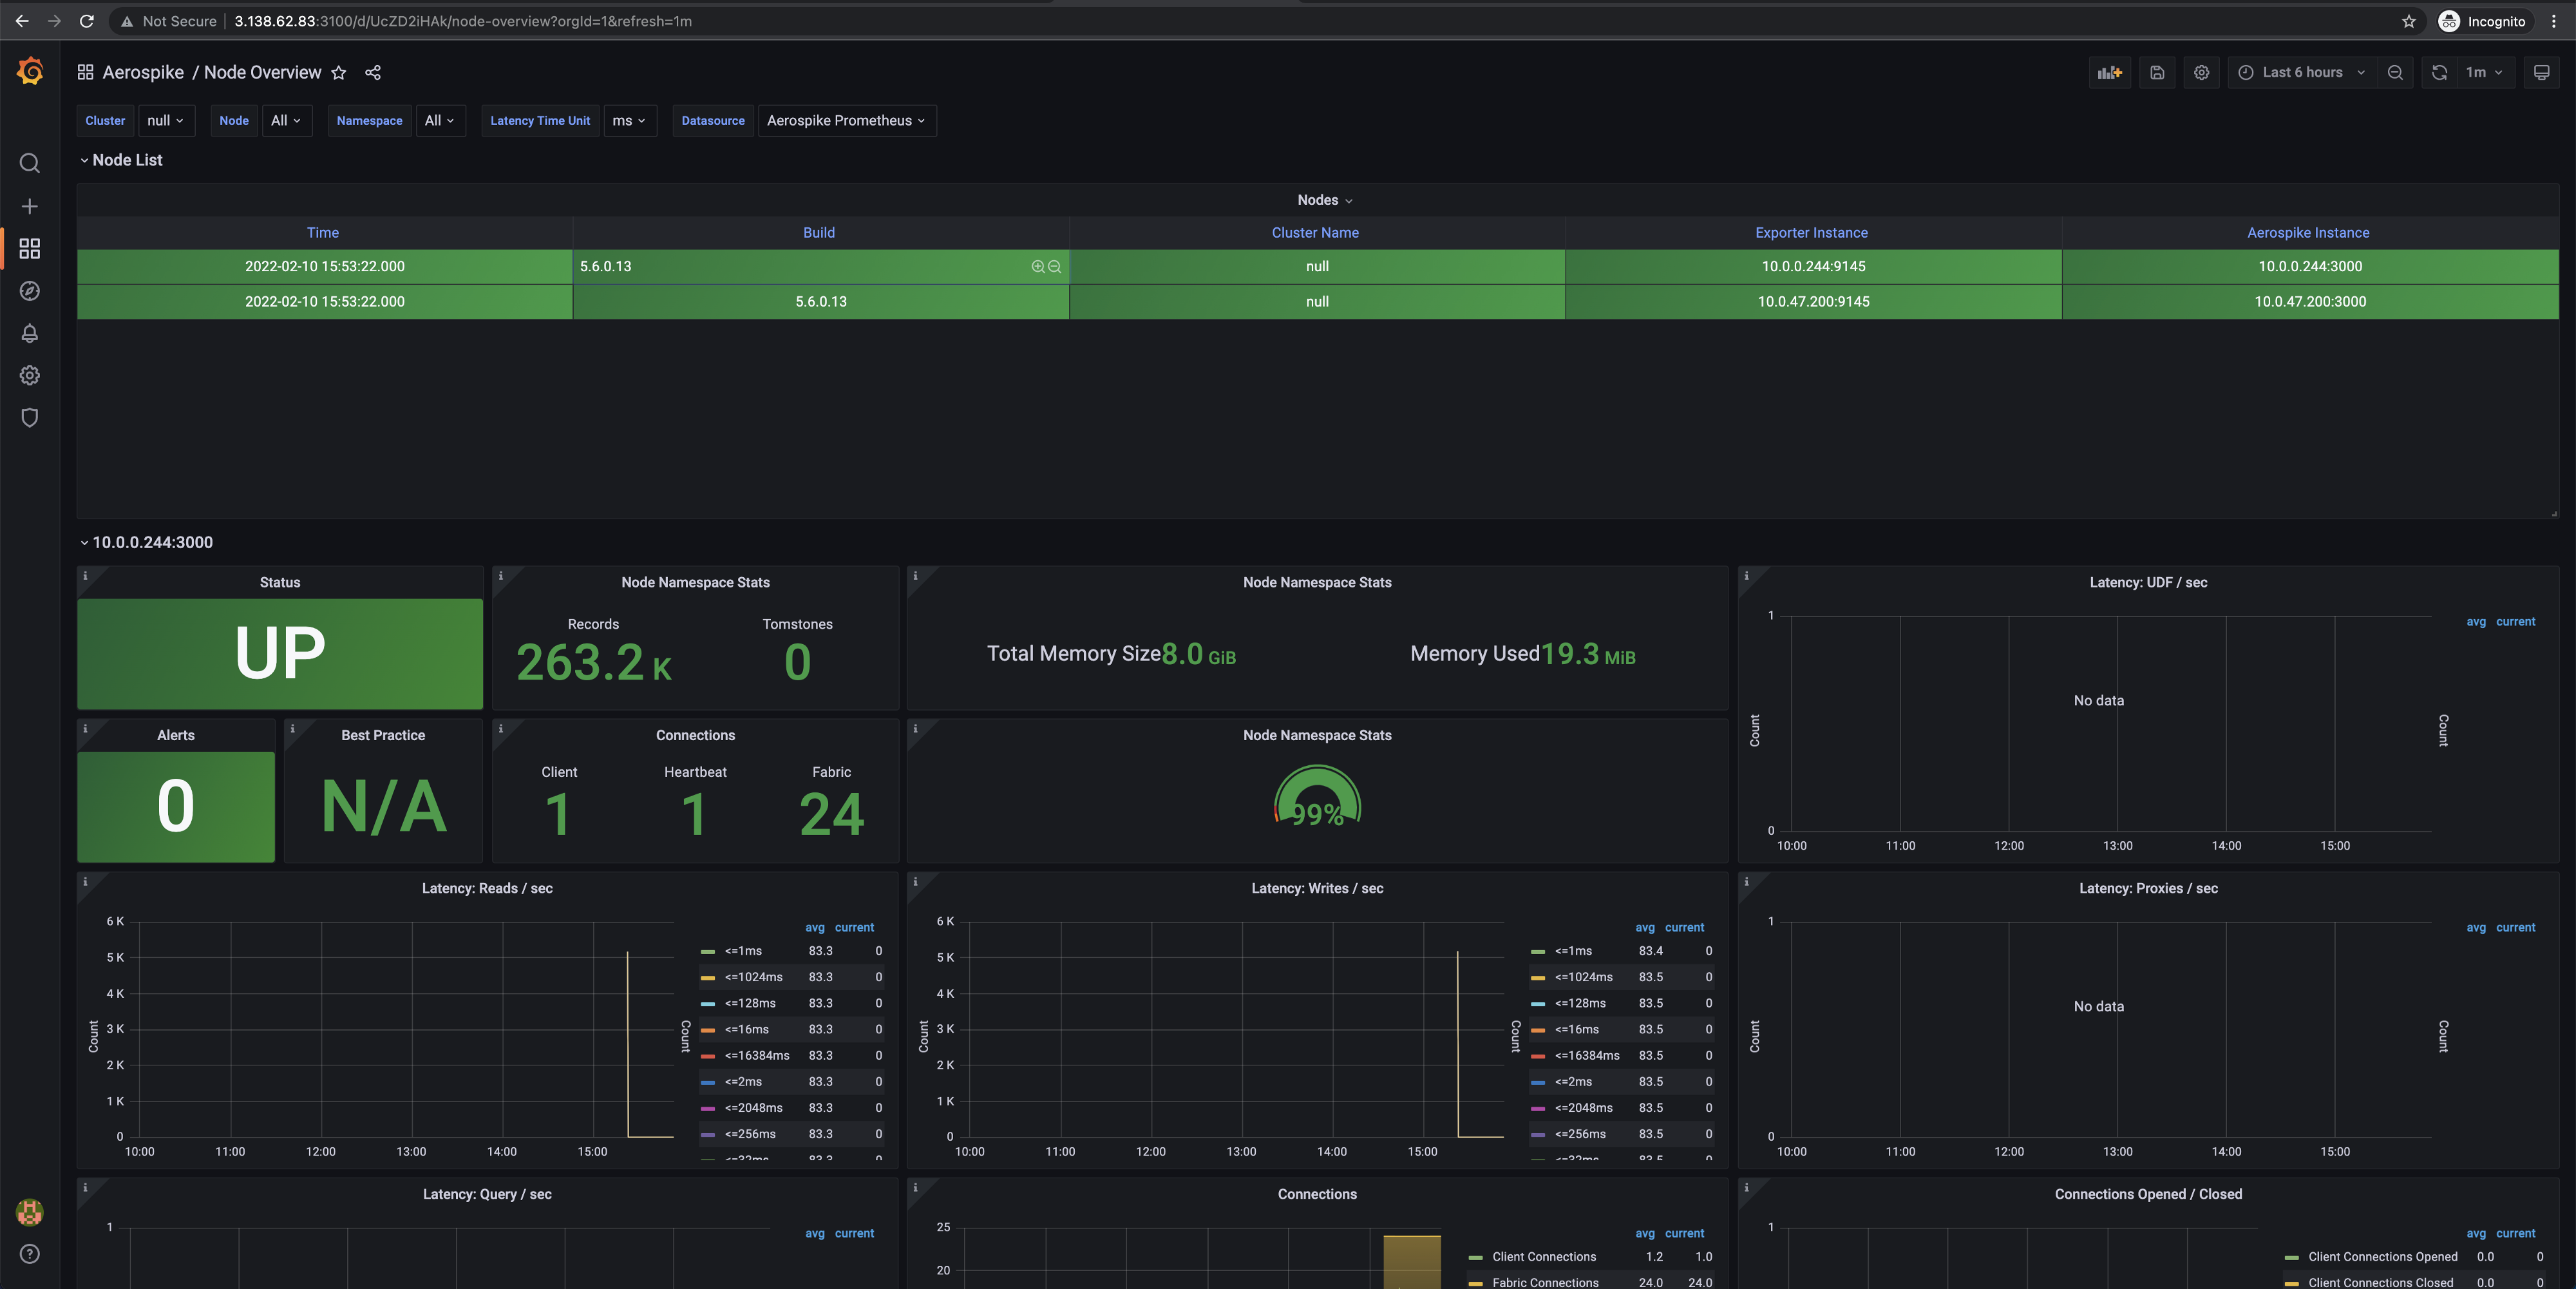
Grafana dashboard
Using asbench
asbench is installed in the monitoring host to enable a user to measure the performance of an Aerospike cluster.
Sample asbench run looks as follows :
[ec2-user@ip-10-0-159-37 ~]$ asbench -h 10.0.0.244 --workload RU,50 --duration 5
hosts:                  10.0.0.244
port:                   3000
user:                   (null)
services-alternate:     false
namespace:              test
set:                    testset
start-key:              1
keys/records:           1000000
object spec:            I4
- duration: 5
  desc: default config (specify your own with --workload-stages)
  tps: 0
  key-start: 1
  key-end: 1000001
  pause: 0
  batch-size: 1
  async: false
  random: false
  workload: RU,50%
  stage: 1
  object-spec: I4
  read-bins: (null)
  write-bins: (null)
threads:                16
enable compression:     false
compression ratio:      1.000000
read socket timeout:    30000 ms
write socket timeout:   30000 ms
read total timeout:     1000 ms
write total timeout:    1000 ms
max retries:            1
debug:                  false
latency:                false
latency histogram:      false
cumulative HDR hist:    false
shared memory:          false
read replica:           sequence
read mode AP:           one
read mode SC:           session
write commit level:     all
conn pools per node:    1
async max commands:     50
event loops:            1
auth mode:              INTERNAL
2022-02-10 23:57:58.515 INFO Add node BB9D03474C82D02 10.0.0.244:3000
2022-02-10 23:57:58.515 INFO Add node BB954E433567006 10.0.47.200:3000
2022-02-10 23:57:58.519 INFO Start 16 transaction threads
Stage 1: default config (specify your own with --workload-stages)
2022-02-10 23:57:59.519 INFO write(tps=9154 timeouts=0 errors=0) read(tps=9160 timeouts=0 errors=0) total(tps=18314 timeouts=0 errors=0)
2022-02-10 23:58:00.519 INFO write(tps=9938 timeouts=0 errors=0) read(tps=10033 timeouts=0 errors=0) total(tps=19971 timeouts=0 errors=0)
2022-02-10 23:58:01.519 INFO write(tps=9422 timeouts=0 errors=0) read(tps=9552 timeouts=0 errors=0) total(tps=18974 timeouts=0 errors=0)
2022-02-10 23:58:02.519 INFO write(tps=8177 timeouts=0 errors=0) read(tps=8149 timeouts=0 errors=0) total(tps=16326 timeouts=0 errors=0)
2022-02-10 23:58:03.519 INFO write(tps=10131 timeouts=0 errors=0) read(tps=10201 timeouts=0 errors=0) total(tps=20332 timeouts=0 errors=0)
2022-02-10 23:58:03.520 INFO write(tps=8977 timeouts=0 errors=0) read(tps=12567 timeouts=0 errors=0) total(tps=21544 timeouts=0 errors=0)
Wrapping up
We have described the new additions to Aerospike’s AWS Quick Start and shown some of the ways these can validate your deployments and monitor the clusters you deploy. For details please see Aerospike Database Enterprise Edition — Quick Start. For more information on how Aerospike can help you develop scalable and high-performance applications see the Aerospike Developer Hub and the official documentation.
Aerospike is hiring! If you’re interested in technical challenges within a growing team, take a look at our available jobs here: https://boards.greenhouse.io/aerospike
Resources
Aerospike Database Enterprise Edition on the AWS Cloud
Aerospike is a real-time NoSQL data-storage platform. It delivers predictable performance at petabyte scale with…*aws-quickstart.github.io
The Aerospike Database includes instrumentation that provides instantaneous and cumulative metrics for the cluster…*aerospike.com
**Aerospike Benchmark (asbench) | Aerospike Documentation**
The Aerospike Benchmark tool measures the performance of an Aerospike cluster. It can mimic real-world workloads with…*docs.aerospike.com