Sound business decisions lean heavily on solid business intelligence, commonly referred to as “BI”. Its purpose is to support better business decision-making. BI tools such as Tableau, Micro-strategy, Looker, Qlik, etc. are a staple in the toolbox of a business analyst or a data analyst. However, analysts not only care about premier dashboarding and analytics capabilities but also the speed of analysis. Interactive dashboarding demands near real-time response times to be impactful. BI workloads are read-heavy and require low latency and high throughput. Smaller datasets can be cached into the BI tool, but larger datasets must reside in a database and are queried on a need basis. No matter how optimized your BI engine is, all performance gains are wiped out by slower reads from an underlying database. Under the covers, BI queries are standard SQL queries over a JDBC interface that is supported by the majority of the BI tools.
Aerospike is a highly scalable NoSQL database and with its hybrid memory architecture, is an ideal database for interactive dashboarding. It is typically deployed into real-time environments managing terabyte to petabyte data volumes. With its multi-site clustering capability, Aerospike offers a globally consistent view to geographically distributed business and data analysis teams to accelerate time-to-insight. It can be deployed alongside other scalable distributed software such as Kafka, Presto, Spark, etc. via the Aerospike Connect product line for data analysis. Our recently announced Aerospike Connect for Presto, allows data analysts to use ANSI SQL, which is the lingua franca for data analysis, to query data in Aerospike via Presto. Presto is a highly parallel and distributed SQL query engine. Further, it is multi-tenant and capable of concurrently running hundreds of memory, I/O, and CPU-intensive queries, and scaling to thousands of workers. It offers a JDBC interface, which is supported by BI tools such as Tableau, Looker, and others via a JDBC driver. Figure 1 depicts a high-level architecture.
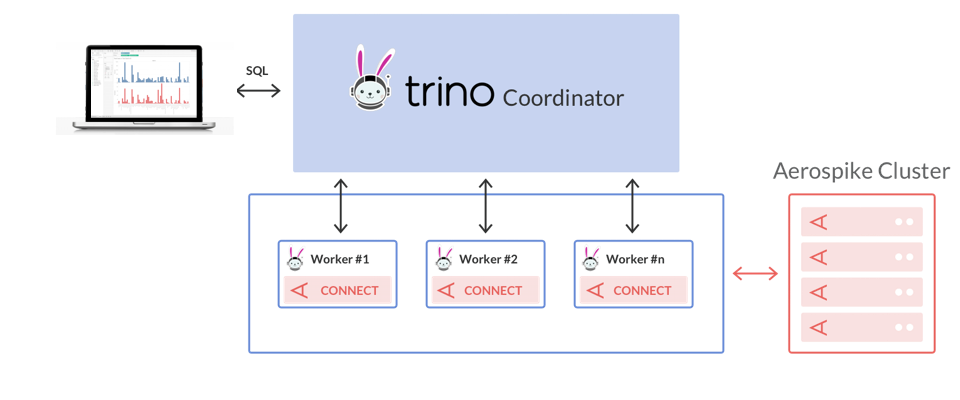
Figure 1: High-Level Architecture for interactive dashboarding
To illustrate how you can analyze data quickly to aid critical business decisions, we will analyze the COVID dataset published by CDC in this blog. Note that this is not a scientific analysis of COVID data and the CDC dataset was used for illustration purposes only.
Prerequisites
Download the COVID dataset from the CDC website
Launch the Aerospike server if you haven’t deployed it already.
If the database is not already populated with data, use the Aerospike Client to write the dataset to Aerospike
Install and configure Presto (Trino distribution)
Install Tableau Desktop
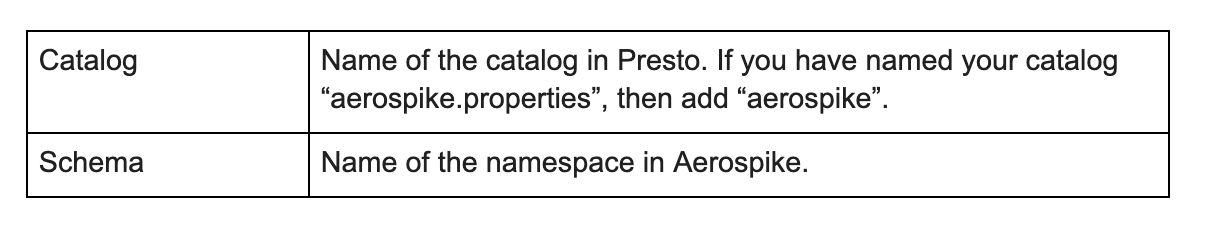
Install and configure the Aerospike Presto Connector. If you plan to provide schema, map the Aerospike bins to Presto column names and types and add the schema to the Presto catalog. You can also choose not to provide the schema in which case the Presto connector will infer the schema.
Steps to create your interactive dashboard
Step 1 — Connect to Presto/Aerospike In Tableau
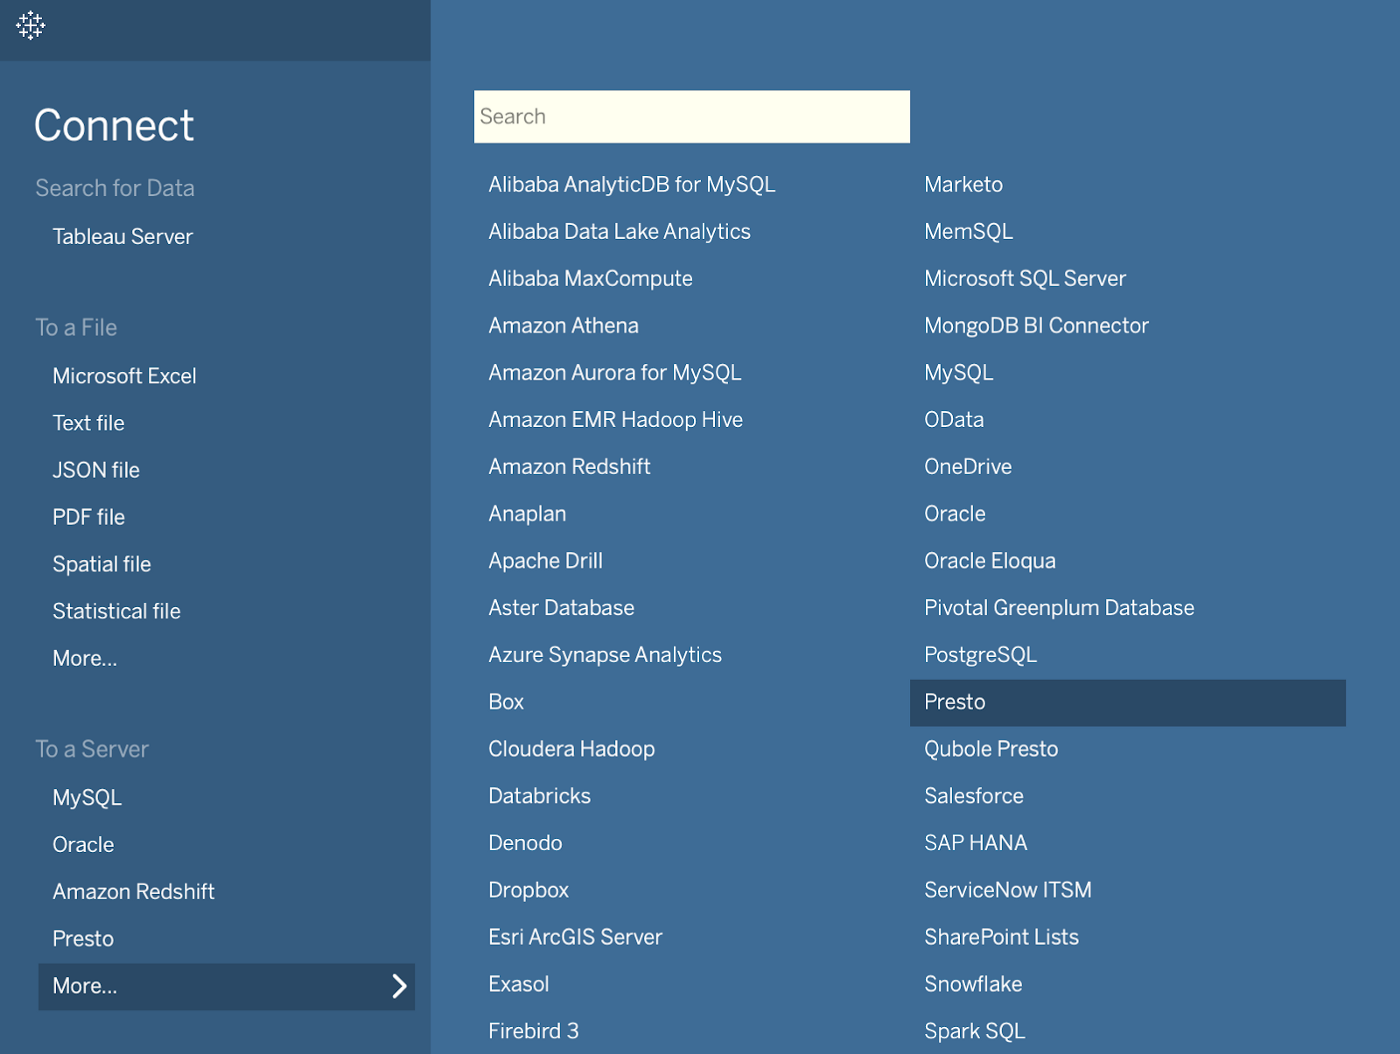
Figure 2 Navigate the Tableau Desktop main menu
The instructions for configuring the connection and setting up the data source can be found on the Tableau website. However, you would have to specify the below to analyze the data stored in Aerospike.
Step 2 — Load Data from Aerospike Into Tableau
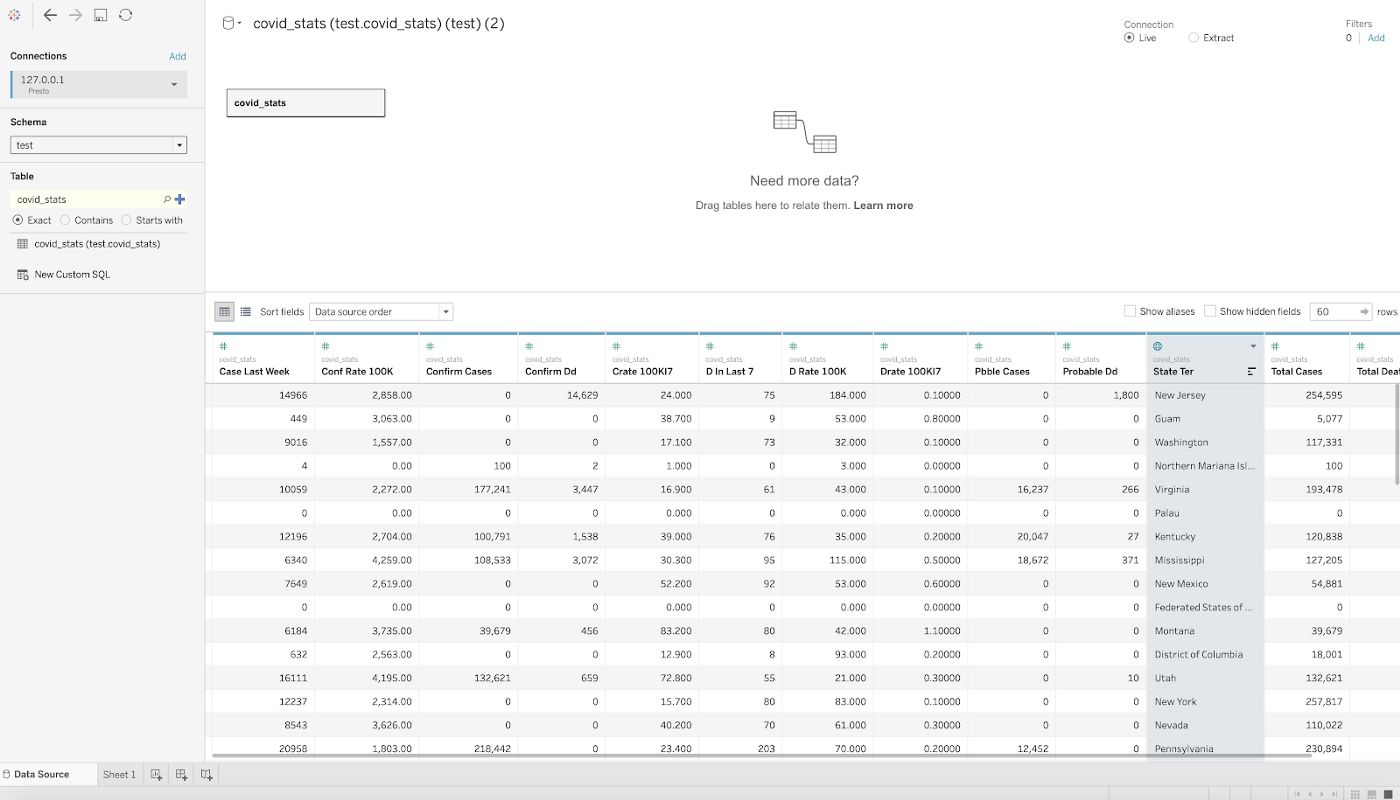
Figure 3 Quickly inspect data

The column names map to the bin names in Aerospike. Note that the order of the columns is hard to maintain during schema inference because the Presto connector uses parallel scans under the covers to speed up data loads and is not aware of the schema a priori. However, the schema should not matter at this point because the goal here is to visualize data. If column ordering is important to you, you can provide schema using table definition in the Presto catalog.
Step 3- Finally, Analyze Data
Figure 4 shows total cases vs. the total deaths per state/territory in the US. California seems to have the highest total cases, followed by Texas, but New York City has the highest number of deaths.
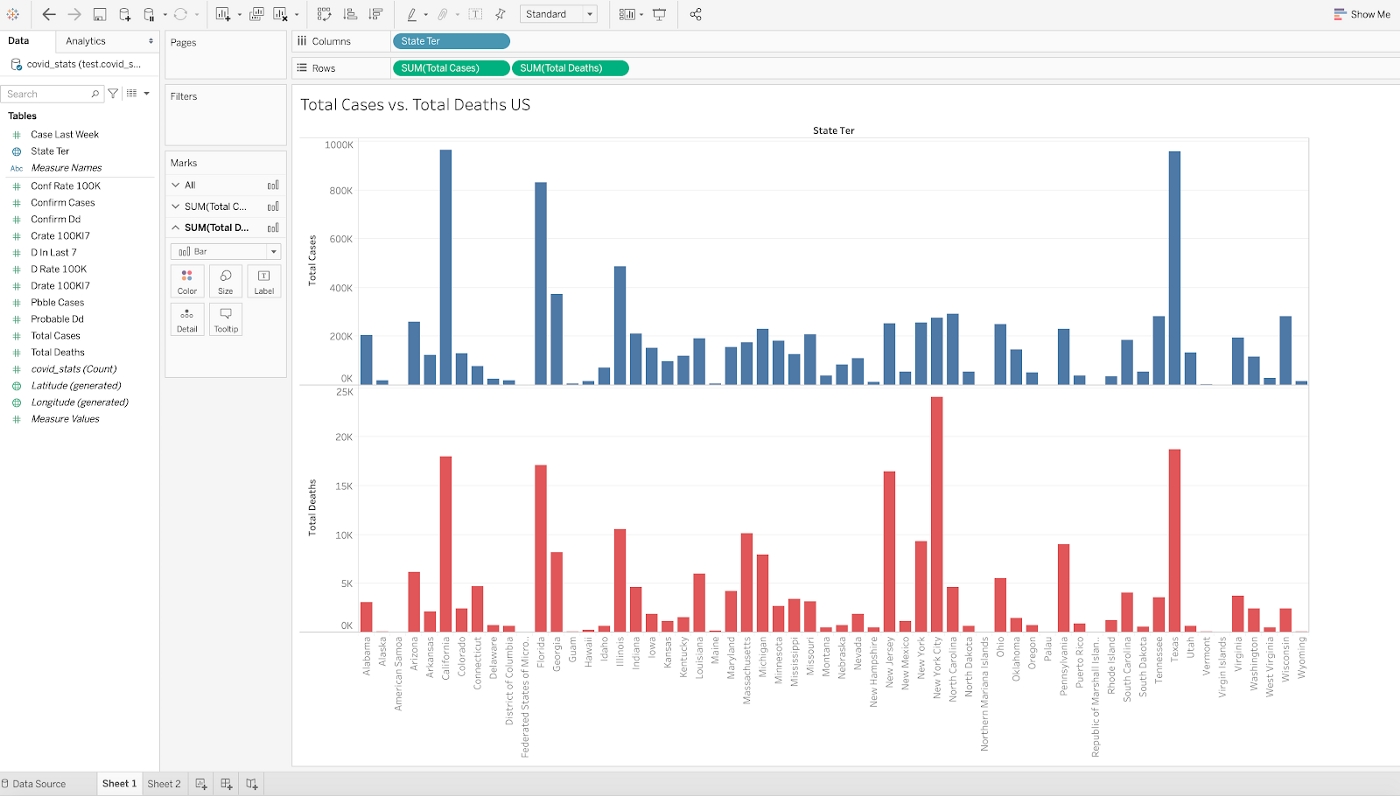
Figure 4
Figure 5 shows that North Carolina has had the highest death rate in the last 7 days.
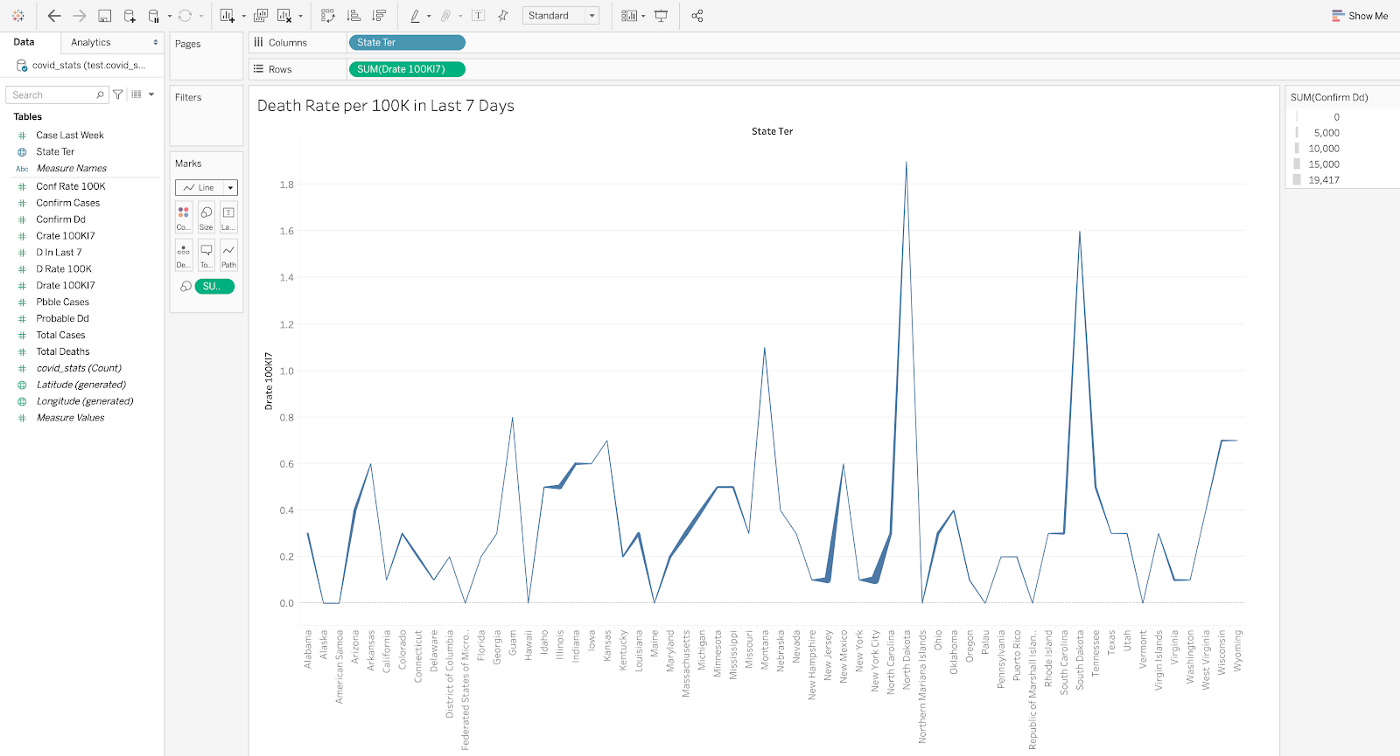
Figure 5
Figure 6 shows that North Dakota has the highest case rate per 100K residents, but New York has the highest death rate per 100K residents.
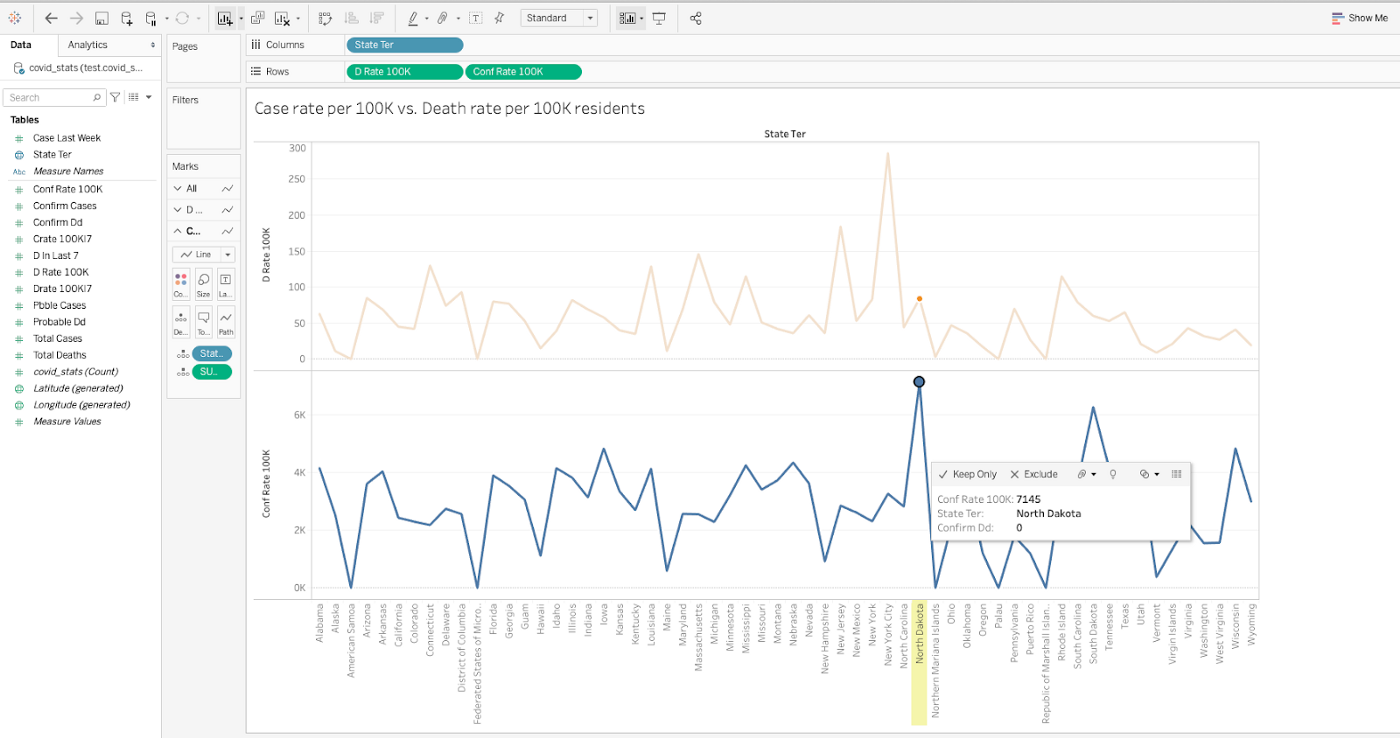
Figure 6
You can now generate insights from data stored in Aerospike with a BI tool of your choice by using Aerospike Connect for Presto and drive down your time-to-insight. Visit our documentation for details and check out our product blog for understanding the key features.